


As of 2023, there is a wide variety of shows, web series, movies, and other content available for streaming on OTT platforms. Comedy stands out as the most popular content category across these platforms, appealing to viewers of all ages. In fact, by the end of 2023, it is projected that OTT platforms will generate a staggering $316.10 billion in revenue.
If you're interested in delving deeper into the realm of OTT revenue, the marketplace, and its users, we have compiled an article that presents all the latest OTT statistics. Our research has encompassed a comprehensive range of OTT facts and figures to provide you with valuable insights.
At a Glance: OTT Statistics
In 2022, there were 3.26 billion OTT users, which is expected to increase to 3.5 billion by 2023.
The projected revenue generated by OTT platforms in 2023 is $316.10 billion, compared to $272.70 billion in 2022.
The average revenue per user (ARPU) for OTT platforms was $83.57 in 2022, and it is expected to rise to $90.14 in 2023.
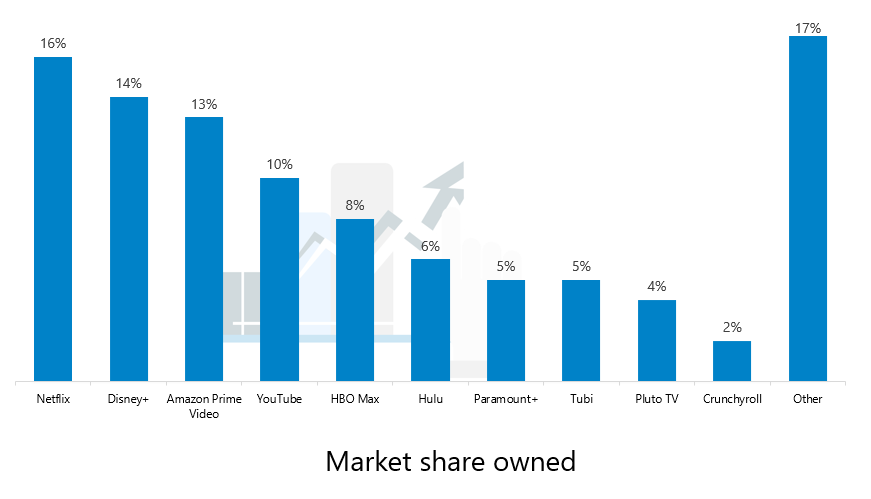
Netflix is the largest shareholder in the OTT market, holding 16% of the market share. Disney+ follows with 14%, and Amazon Prime Video with 13%.
In the United States, OTT videos generated $119.1 billion in revenue in 2022 and are projected to reach $137.8 billion in 2023.
The OTT market is expected to reach a valuation of $240.55 billion by the end of 2023.
The OTT video advertising market is projected to reach $205.10 billion by the end of 2023.
In 2022, Canada had the highest OTT penetration rate at 89.1%, followed by New Zealand at 85.3% and the United Kingdom at 85.1%.
What is the number of people using OTT?
According to predictions, the number of OTT users is expected to increase to 3.5 billion in 2023, showing growth from 3.23 billion in 2022.
Below is a table showcasing the growth of OTT users over the years:
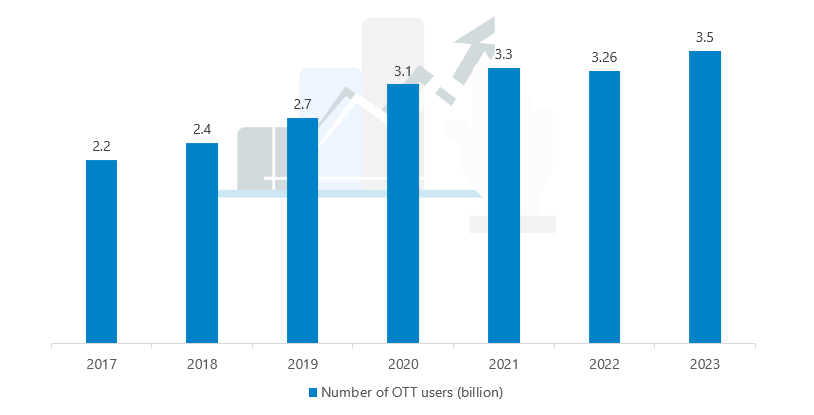
Source: Statista
In contrast, it is projected that OTT platforms will have approximately 4.2 billion users by 2027. The following table outlines the predicted growth of OTT users in the coming years:
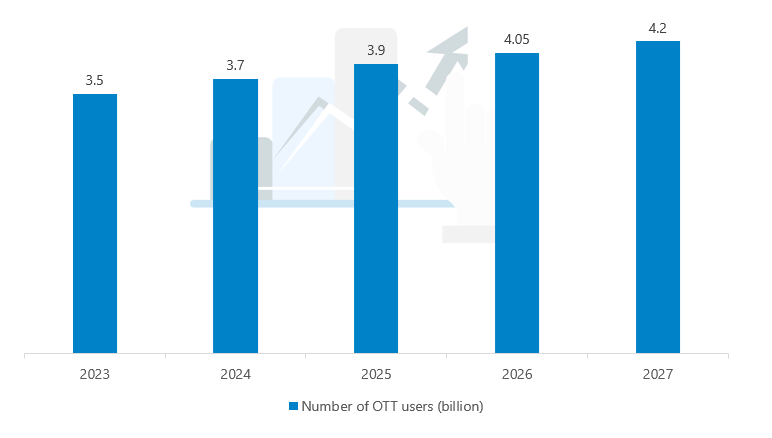
Source: Statista
In 2022, free OTT videos supported by advertisements were estimated to have a user base of around 2.7 billion. This number is projected to increase to 2.82 billion users by 2023. The table below displays the user count for individuals who utilize free (ad-supported) OTT videos:
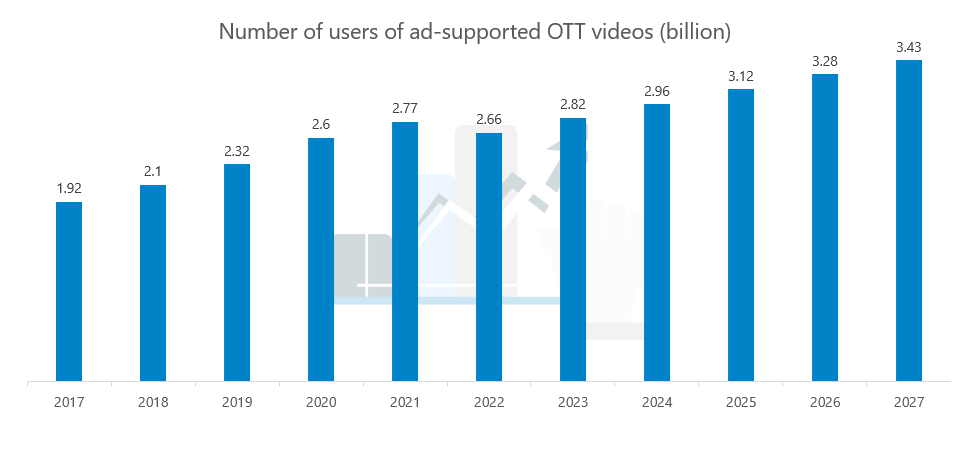
Source: Statista
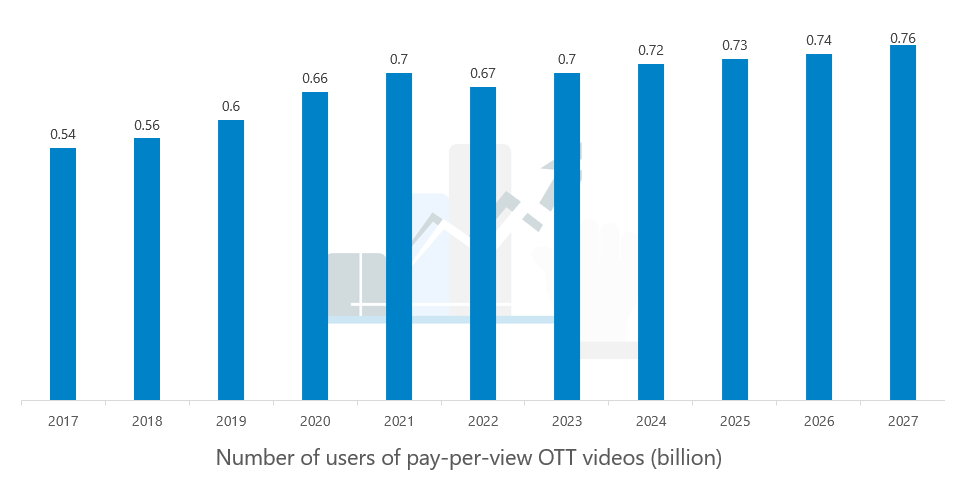
In 2022, the number of pay-per-view OTT users was 0.68 billion, which increased to 0.75 billion in 2023. The table below illustrates the trend of pay-per-view OTT users over the years:
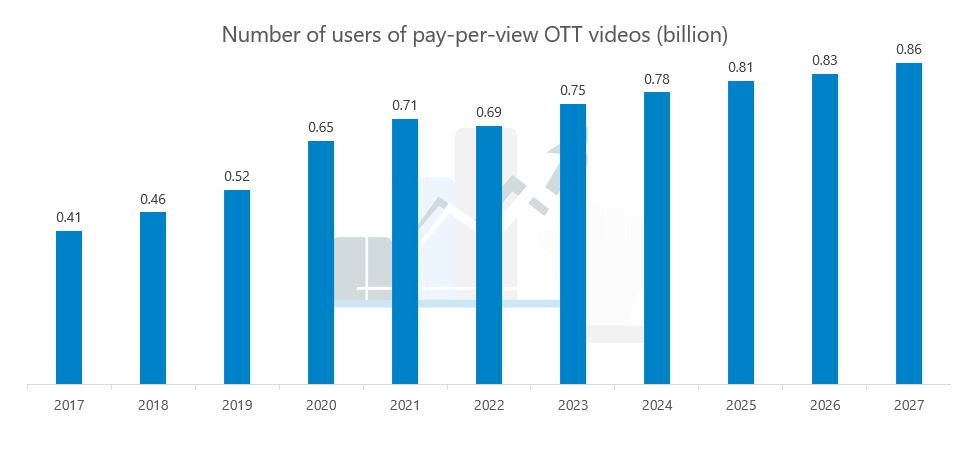
Source: Statista
It is predicted that by 2023, approximately 0.7 billion users will watch OTT videos by downloading them. The table below presents the number of users who have enjoyed OTT video downloads over the years:
Source: Statista
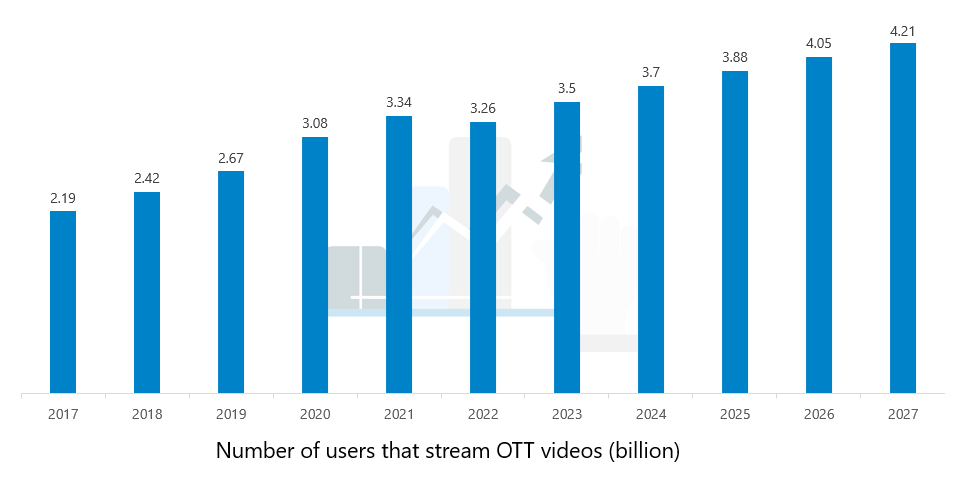
As of 2022, the number of users streaming OTT videos stood at 1.16 billion. This figure is expected to grow to 1.29 billion by 2023. The table below illustrates the trend of online video streaming by OTT users:
Source: Statista
Statistics on OTT revenue
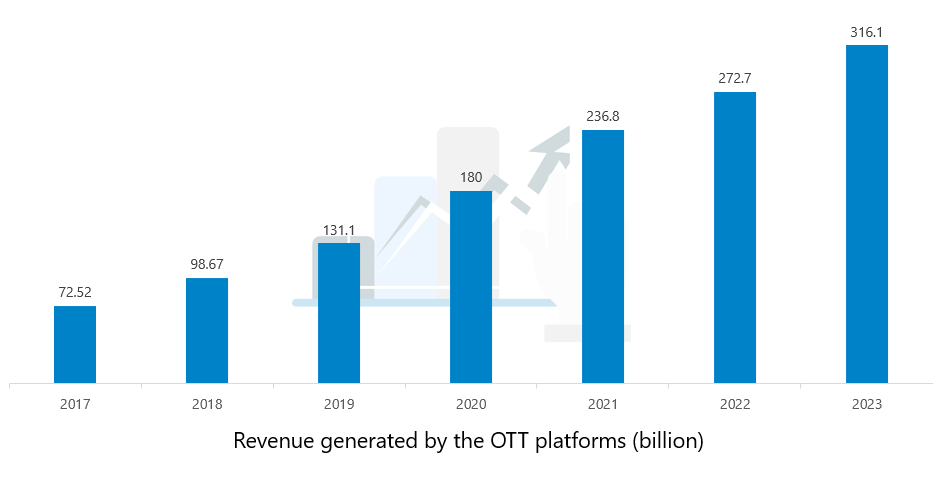
Over the years, OTT platforms have witnessed a significant growth in revenue. In 2022, these platforms generated $272.70 billion in revenue, and it is projected that by the end of 2023, this figure will increase to an impressive $316.10 billion.
Over the past few years, OTT platforms have generated the following yearly revenue.
Source: Statista
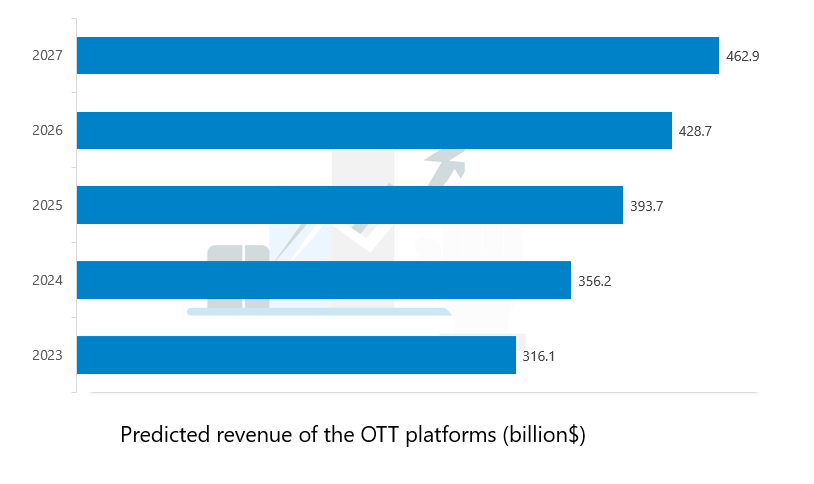
According to predictions, by 2027, OTT platforms are expected to generate $462.90 billion in revenue. The table below illustrates the predicted revenue values for the upcoming years:
Source: Statista
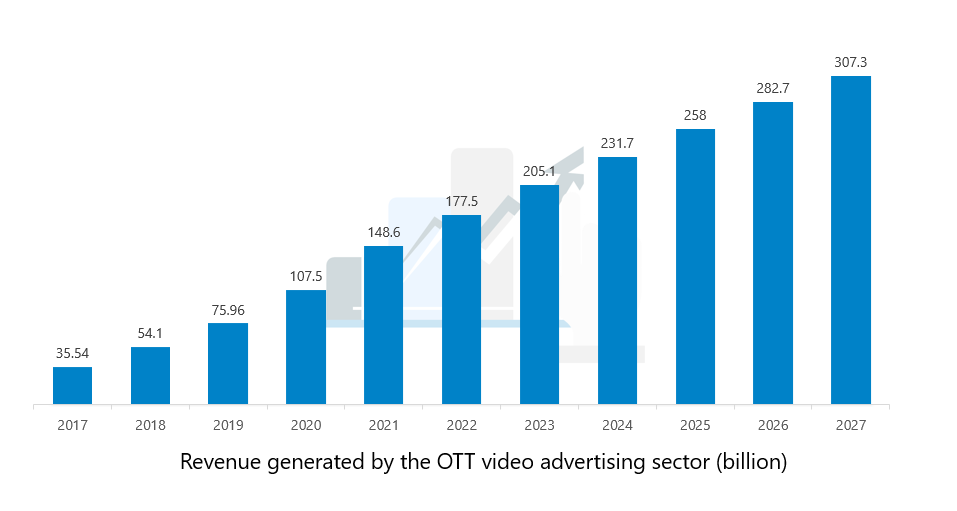
The revenue generated by different OTT sectors
OTT platforms generate revenue through four segments: OTT video advertising, Pay-Per-View, Video downloads, and Video streaming.
Take a look at each sector's revenue.
The OTT Video Advertising segment is expected to generate $ 205.10 billion in revenue in 2023, up from $ 177.50 billion in 2022.
Below is a table that shows the revenue generated by the OTT video advertising sector over the past few years.
Source: Statista
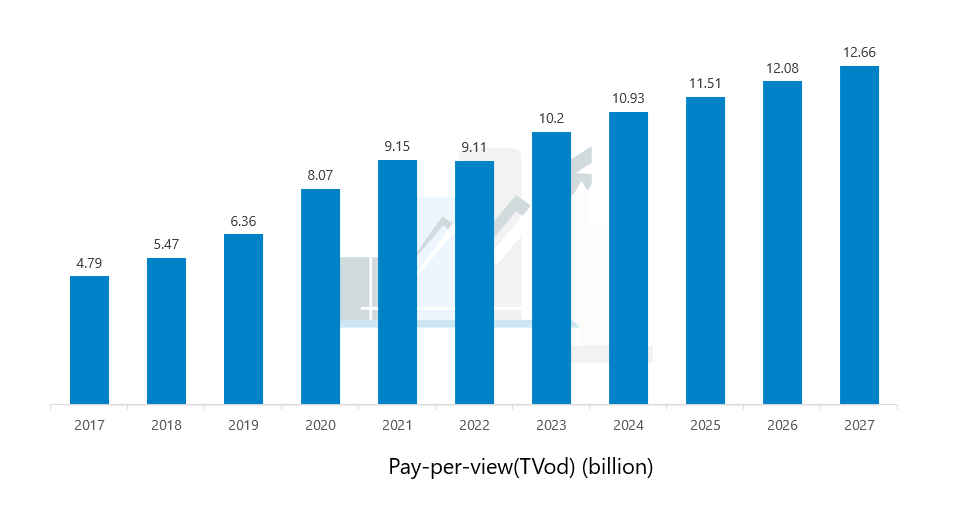
In 2022, pay-per-view (TVoD) generated $9.11 billion. By 2023, it is expected to generate $10.20 billion.
Throughout the table, you will find the revenue generated by pay-per-view (TVoD) over the past few years, as well as predictions for the future.
Source: Statista
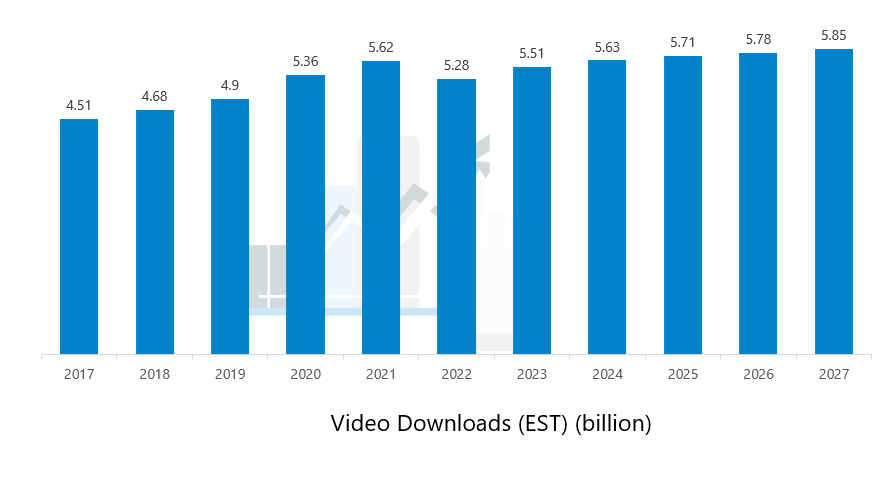
OTT platforms generated $5.28 billion in revenue from video downloads in 2022, but are expected to generate $ 5.51 billion in revenue in 2023.
As well as the predicted values for the upcoming years, the following table shows the revenue generated by video downloads over the past few years.
 Source: Statista
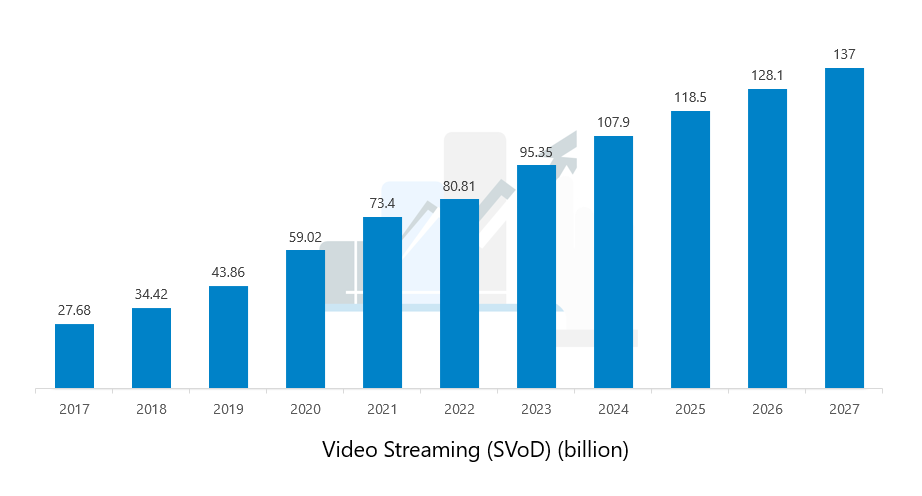
SVoD generated $80.81 billion in revenue in 2022. By 2023, it is predicted to generate $95.35 billion.
Below is the revenue generated by Video Streaming (SVoD) over the past few years, as well as the predicted revenue for the next few years.
Source: Statista
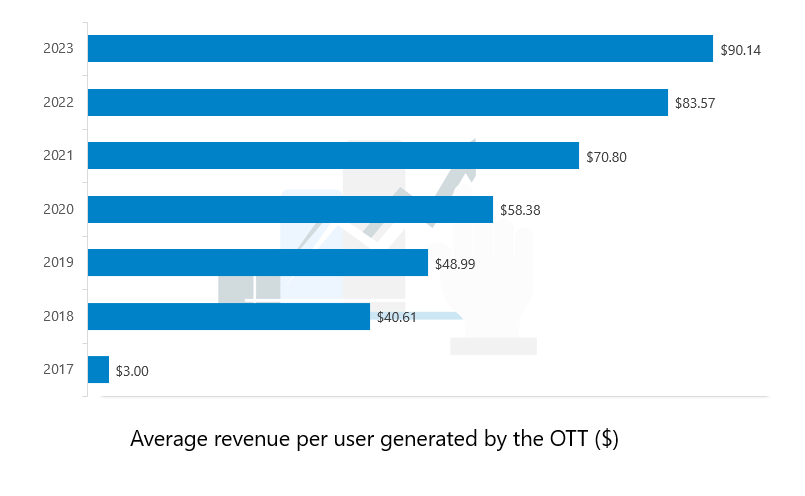
OTT's average revenue per user (ARPU)
OTT videos generated an average revenue per user of $83.57 in 2022, and $90.14 billion in 2023.
OTT's ARPU over the past few years is shown in the following table.
Source: Statista
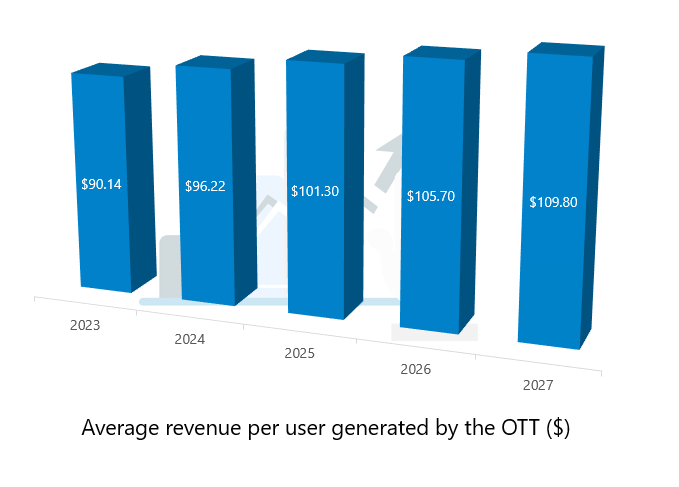
According to estimates, OTT will generate $109.80 billion in revenue per user by 2027.
ARPU values for the upcoming years are shown in the following table.
Source: Statista
OTT Sectors' Average Revenue Per User
Here are the average revenues generated by various OTT video sectors.
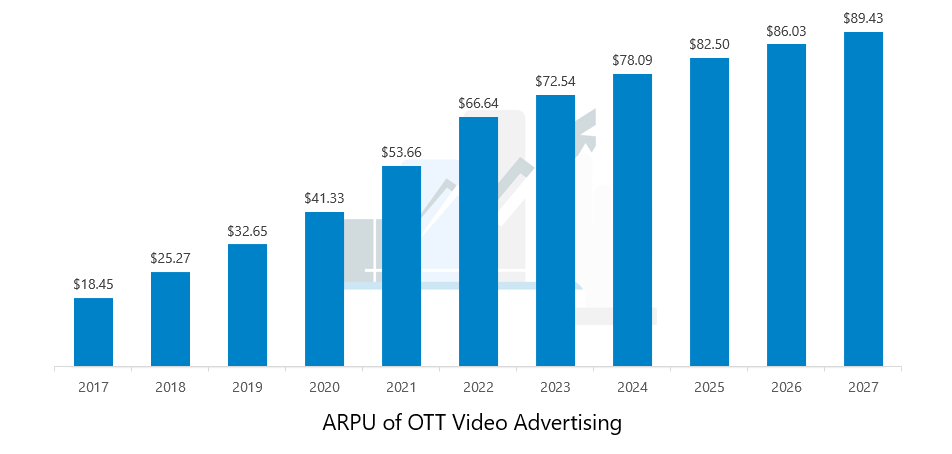
In 2022, OTT Video Advertising generated an average revenue per user of $66.64, while it may generate an ARPU of $72.54 in 2023.
The following table shows the ARPU generated by OTT Video Advertising over the past few years and predicted values in the future.
Source: Statista
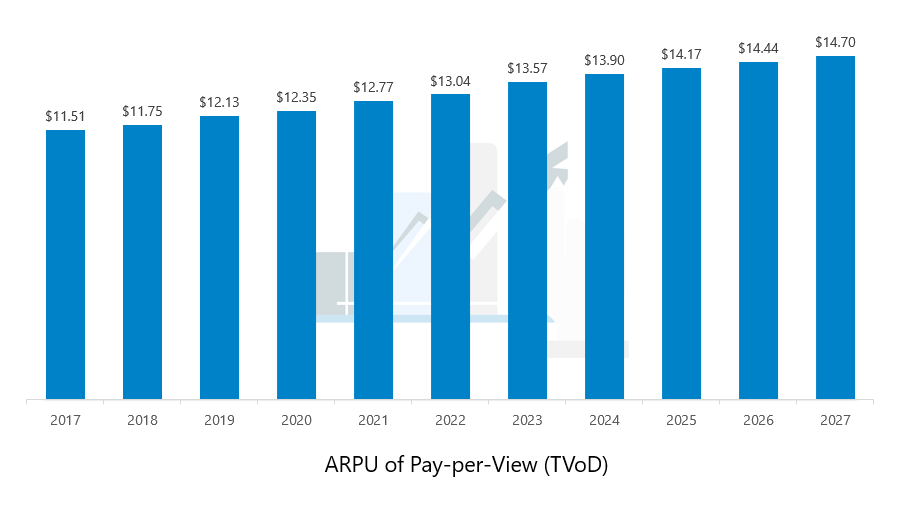
As of 2022, Pay-per-View (TVoD) generated an average revenue per user of $13.04. In addition, it is expected to generate a revenue of $13.57 by 2023.
In the following table, you will find the ARPU generated by Pay-per-View over the past few years, as well as predictions for the future.
Source: Statista
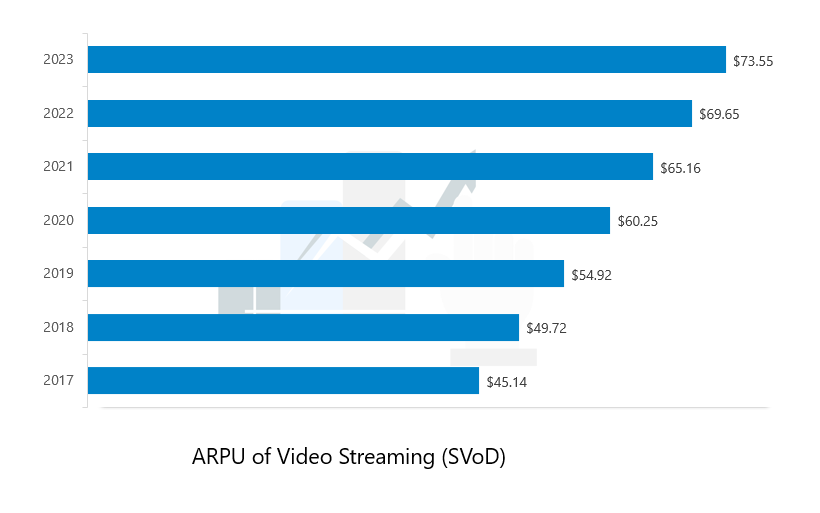
EST generated $7.78 in average revenue in 2022, while ARPU is expected to be $7.81 in 2023.
This table displays the ARPU generated by Video Streaming (SVoD) in the past and the predicted ARPU for the upcoming years.
Source: Statista
Market share of OTT services
The Netflix share of the OTT video market is approximately 16%, followed by Disney+ with a market share of 14%.
In the OTT video segment, the following table displays the market share of different OTT providers.
Source: Statista
Country-specific OTT revenue size
US OTT platforms generated $119.1 billion in revenue in 2022, and the United States has the most OTT users, so it generates the most revenue. It is projected that it will generate $137.8 billion in 2023.
Below is a list of the top 10 countries in terms of OTT revenue generation.
|
Country |
Revenue generated by OTT videos in 2022 |
Revenue generated by OTT videos in 2023. |
|
United States |
119.1 billion |
137.8 billion |
|
China |
63.5 billion |
74.13 billion |
|
United Kingdom |
13.9 billion |
16.17 billion |
|
Japan |
8.79 billion |
9.75 billion |
|
Germany |
7.12 billion |
8.44 billion |
|
Canada |
5.73 billion |
6.61 billion |
|
Australia |
4.50 billion |
5.14 billion |
|
France |
4.48 billion |
5.34 billion |
|
South Korea |
4.02 billion |
4.57 billion |
Source: Statista
The Seychelles generates the least OTT revenue worldwide. In 2022, the country generated a revenue of 1.96 million. In 2023, the country is expected to generate $2.18 million in revenue.
Globally, the following table shows which countries generate the least OTT revenue.
|
Country |
Revenue generated by OTT videos in 2022 |
Revenue generated by OTT videos in 2023. |
|
Seychelles |
1.96 million |
2.18 million |
|
Gambia |
2.77 million |
3.28 million |
|
Belize |
3.30 million |
3.63 million |
|
Burundi |
4.14 million |
4.86 million |
|
Suriname |
4.27 million |
4.74 million |
|
Timor-Leste |
4.30 million |
4.80 million |
|
Sierra Leone |
5.58 million |
6.63 million |
|
Bhutan |
6.25 million |
6.92 million |
|
Togo |
6.33 million |
7.42 million |
|
Lesotho |
6.43 million |
7.01 million |
Source: Statista
In 2022, OTT videos had the highest penetration rate in Canada, at 89.1%, and by 2023 it is expected to reach 90%.
According to the following table, OTT videos are popular in the leading countries.
|
Country |
OTT penetration rate in 2022 |
OTT penetration rate in 2023 |
|
Canada |
89.10% |
90.00% |
|
New Zealand |
85.30% |
88.60% |
|
United Kingdom |
85.10% |
90.00% |
|
United States |
82.70% |
85.20% |
|
Norway |
79.50% |
87.10% |
|
Denmark |
78.90% |
86.90% |
|
Belgium |
78.60% |
87.00% |
|
Australia |
77.60% |
80.20% |
|
Spain |
77.30% |
85.80% |
|
Israel |
76.80% |
79.50% |
Source: Statista
Size of the global OTT market
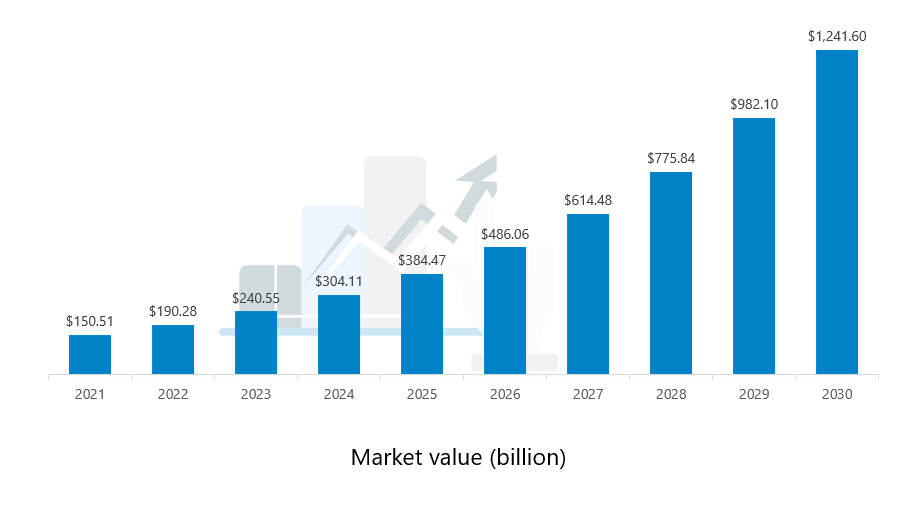
According to OTT statistics, the market value of OTT statistics is expected to reach $240.56 billion in 2023. In addition, the market value of OTT statistics was $190.28 billion in 2022.
Over the years, the market value of OTT statistics has been shown in the following table.
Source: Statista
Statistics on OTT video advertising
By 2023, the global OTT video advertising market volume is expected to reach $205.10.
72% of OTT viewers recognized a specific ad they saw.
While watching OTT videos, 66% of viewers discovered new content.
On OTT platforms, 43% of Americans said they would watch ads in exchange for free content.
OTT video viewers reported paused the video content to research the product they saw in the ad or to make a purchase.
The brand's social media engagement can increase by 24% after advertising its products on OTT platforms.
In exchange for free video content, 25% of OTT viewers would watch a 10-minute advertisement.
A growing number of marketing professionals and agencies are increasing their expenditure on OTT ads as a result of the increased impact of advertisements on OTT viewers.
The OTT platforms account for 40 percent of the total advertising video impressions.
Statistics on OTT live streaming
The consumption of live videos increased by 28% after the pandemic.
On OTT platforms, 12% of people watch live sporting events.
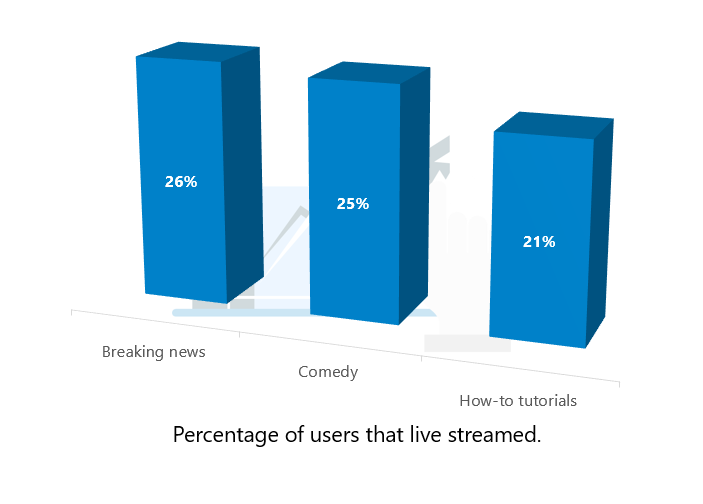
The most popular live streaming content on OTT in the United States was breaking news.
On OTT platforms, the following table displays the top three most live-streamed content.
Source: Statista
OTT Device Streaming Statistics
30% of them are smartphones, while the rest of the devices include Smart TVs, personal computers, tablets, gaming consoles, etc.
The following table displays the top 3 OTT streaming devices in the United States.
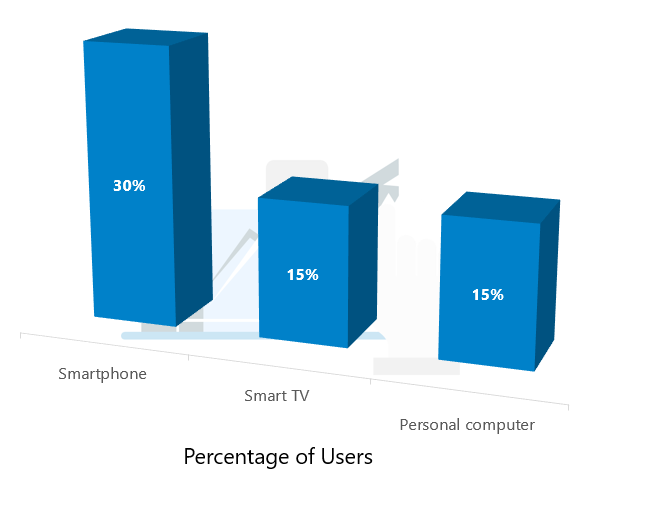
Source: Statista
OTT video viewing time on smart TVs grew 115%, while tablet viewing time grew 43%.
For streaming OTT platforms, the table below shows the growth in view time observed across different devices.
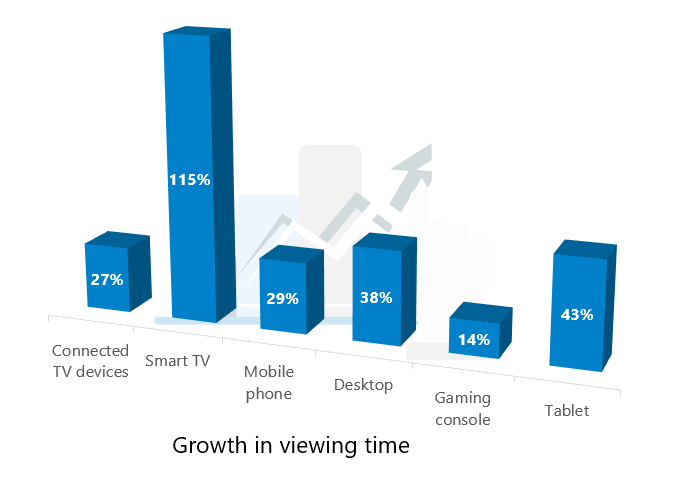
Source: Statista
Statistics specific to OTT platforms
Netflix, Amazon Prime, Disney+, Hulu, HBO Max, Peacock, and others are some of the most popular OTT platforms. Would you like to know some statistics about these platforms?
Listed below are some key stats of the top OTT platforms around the world that most OTT users love.
Netflix!
As of 2023, Netflix has approximately 223 million paid subscribers.
Netflix subscribers over the past few years are shown in the following table.
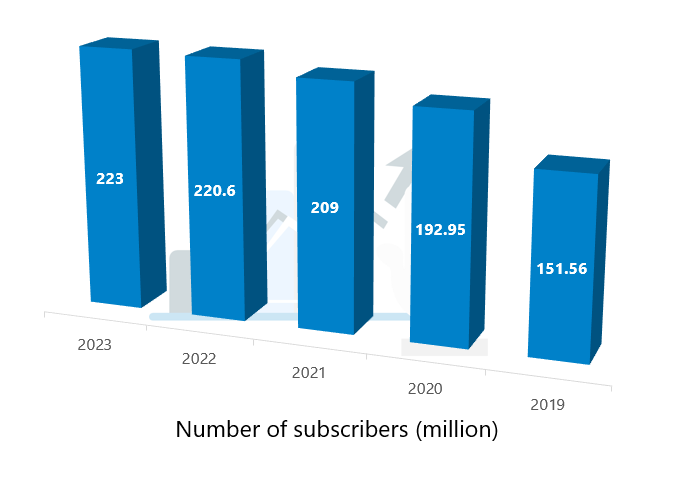
Source: Statista
Netflix generated $31.6 billion in revenue in 2022, an increase of 6.7% from the previous year.
Netflix's net income in 2022 exceeded $5 billion.
Over 73 million Netflix subscribers come from the United States and Canada.
Netflix generates $14 billion in revenue in North America.
Prime membership on Amazon
By 2027, Amazon Prime will surpass Netflix, according to Statista.
The Amazon Prime service is used by more than 200 million people around the world, and 60% of American households subscribe to the service.
Amazon Prime reached $12 billion in daily sales in 2022.
Amazon generated $220 billion in revenue in 2022 from its online stores.
Below is a table showing AMaon's net revenue by product group.
|
Year |
Online stores |
Physical stores |
Retail third-party seller services |
Subscription services |
AWS |
|
2014 |
68.51 billion |
– |
11.75 billion |
2.76 billion |
4.64 billion |
|
2015 |
76.86 billion |
– |
16.09 billion |
4.47 billion |
7.88 billion |
|
2016 |
91.43 billion |
– |
22.99 billion |
6.39 billion |
12.22 billion |
|
2017 |
108.35 billion |
5.8 billion |
31.88 billion |
9.72 billion |
17.46 billion |
|
2018 |
122.99 billion |
17.22 billion |
42.75 billion |
14.17 billion |
25.66 billion |
|
2019 |
141.25 billion |
17.19 billion |
53.76 billion |
19.21 billion |
35.03 billion |
|
2020 |
197.35 billion |
16.23 billion |
80.46 billion |
25.21 billion |
45.37 billion |
|
2021 |
222.08 billion |
17.08 billion |
103.37 billion |
31.77 billion |
62.2 billion |
|
2022 |
220 billion |
18.96 billion |
117.72 billion |
35.22 billion |
80.1 billion |
Source: Statista
As of the first quarter of 2023, Disney+ had 161.8 million subscribers and generated $7.4 billion in revenue.
Over the past few years, Disney Plus has generated the following revenue.
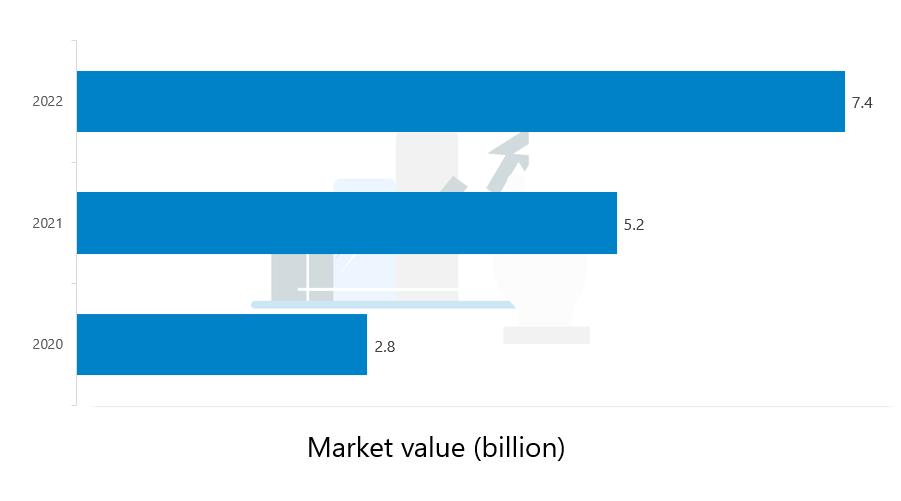
Source: Statista
As of 2023, Disney Plus has been downloaded more than 22 million times.
Disney Plus' revenue in the year 2022 was $7.4 billion, compared to just $5.2 billion in the year 2021.
The number of countries in which Disney+ will be available is expected to double by 2023. Currently it is in more than 42 countries.
Among streaming services, Disney Plus holds 15% of the market share.
User Behavior on OTT
Almost all Americans subscribe to at least one streaming media service, while 75% subscribe to two or more.
Smartphones are used by 73% of Gen Zers to watch OTT content.
OTT TVOD content is regularly watched by 34% of grown-ups.
45% of the population watched more on-demand services than in previous years.
In total, 86% of OTT subscribers plan on maintaining or adding to their subscriptions.
Below is a breakdown of how OTT users view retaining their subscriptions.
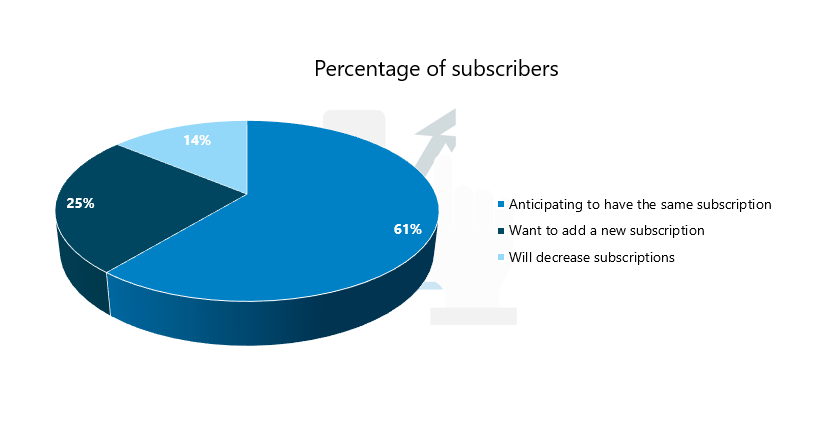
Source: Statista
The OTT Statistics for 2023
That's all I have to say about OTT platforms.
You also have to have subscribed to one of the OTT platforms to fulfill your appetite for daily entertainment. More and more people are switching to OTT platforms. Therefore, it is estimated that most households will have at least two or more OTT subscriptions by the year 2022.
Our website has other latest statistics if you enjoyed reading the above article.